Overview
Dashboards are a collection of reports that have a logical link between them. Together these reports provide you with insights and business intelligence. You should be able to answer a variety of questions related to your marketing activity from analysing the data in these dashboards.
Contents
Accessing Dashboards
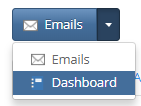
You can access the dashboards by clicking on the drop-down menu on the left side of the screen and selecting Dashboard.
You can send these dashboards to any contact with an email address, just once or set up a recurring send. Click here to find out how to set this up.
Depending on the features you have enabled in Vuture you will see different dashboards in your dashboard home screen. Below is a screenshot of the default dashboards available to every client.
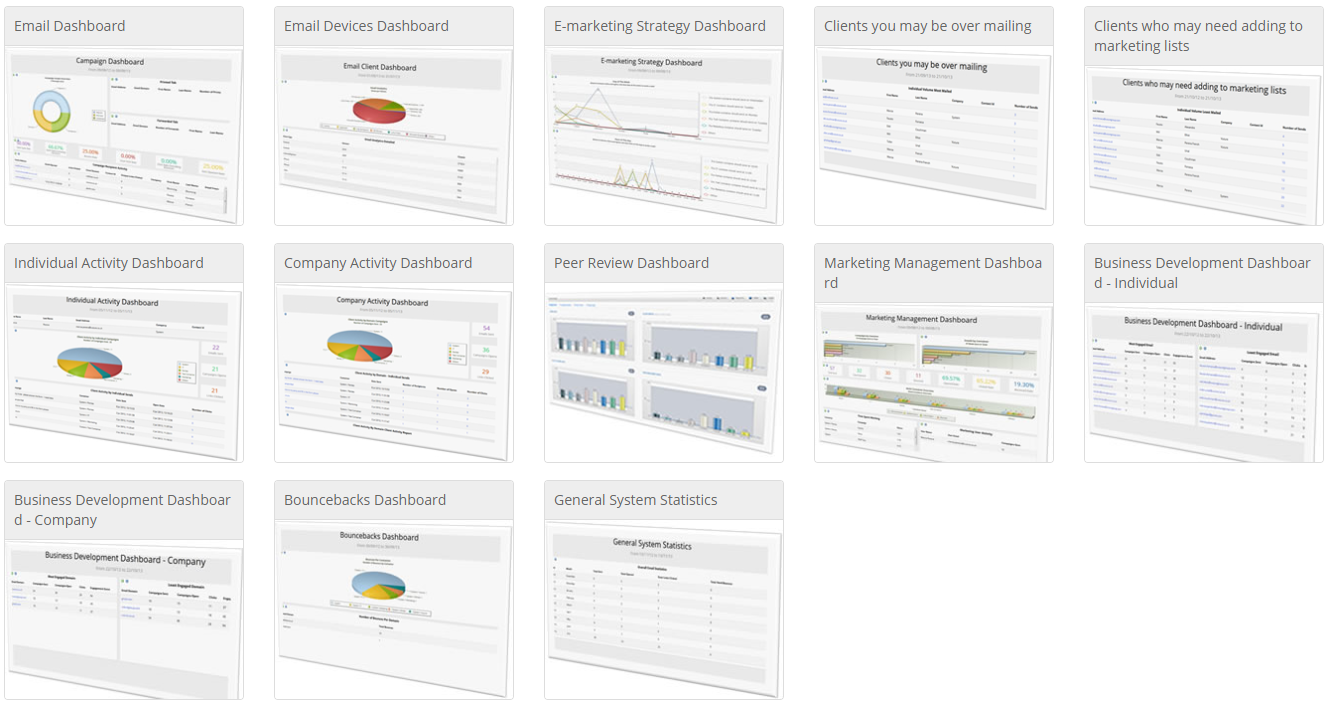
Available to all clients
The following dashboards are available to all clients and do not require you to have enabled certain features.
Email Dashboard
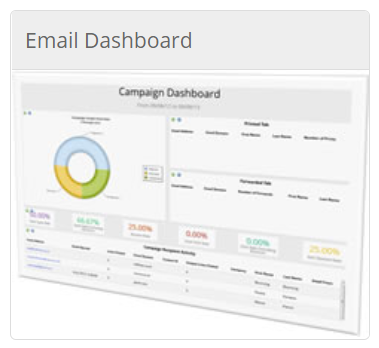
This dashboard gives you an overview of the activity for a specific email. You can select an email and a date range and will give you the recipient's activity for that particular email.
Click here to find out more about this dashboard.
Campaign Dashboard
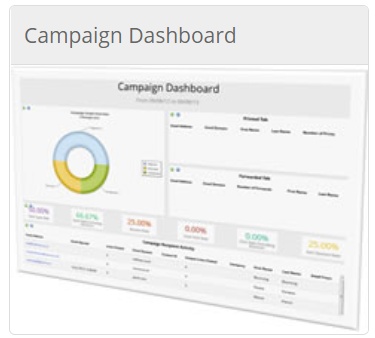
This dashboard gives you an overview of the activity for an entire campaign sent via Vuture. Any email or form included in the Vuture campaign will be included in the report, for any CRM.
Click here to find out more about this dashboard.
Email Devices Dashboard
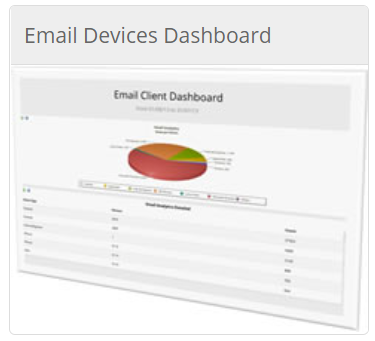
This dashboard allows you to select a particular time, email and container and view the email devices that your recipients use. It also shows by device, the time of day that your recipients open your email.
Click here to find out more about this dashboard.
E-Marketing Strategy Dashboard
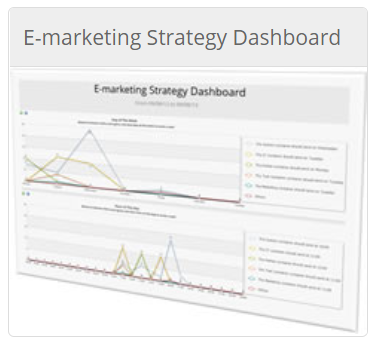
This dashboard shows you by container and time frame what is the best day of the week and also time of day to send your campaign. This is calculated based on when your recipients open your email.
Click here to find out more about this dashboard.
Clients you may be over mailing
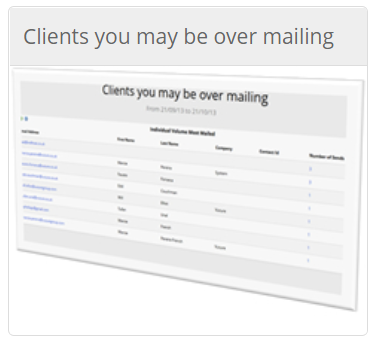
This dashboard shows you a list of the contacts that you have sent to the most.
Click here to find out more about this dashboard.
Clients who may need adding to marketing lists
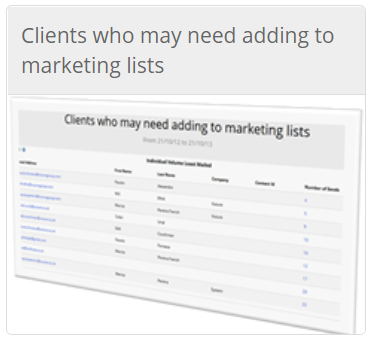
This dashboard shows you a list of the contacts that you have mailed the least.
Click here to find out more about this dashboard.
Individual Activity Dashboard
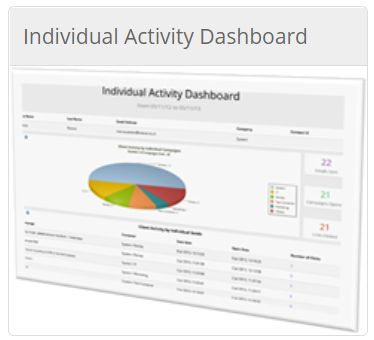
This dashboard shows you the email activity of a single contact. You can filter the dashboard by a certain date range, container, and specific contact. The dashboard shows you which containers have sent this contact emails. Which emails the contact has opened, the best time of day based on open as well as the number of forms that this contact has completed.
Click here to find out more about this dashboard.
Company Activity Dashboard
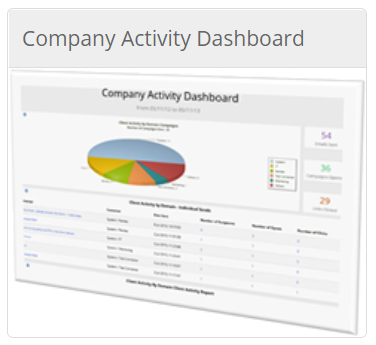
This dashboard shows you the overall activity of the contacts within a specific company. This includes the containers they've been sent from, The emails that those contacts have engaged with and the best time of day to send to the members of that company.
Click here to find out more about this dashboard.
Peer Review Dashboard
This dashboard shows your activity compared against other companies. It allows you to see benchmarks year to year against similar companies. You need to opt in to view the benchmark data.
Click here to find out more about this dashboard.
Marketing Management Dashboard
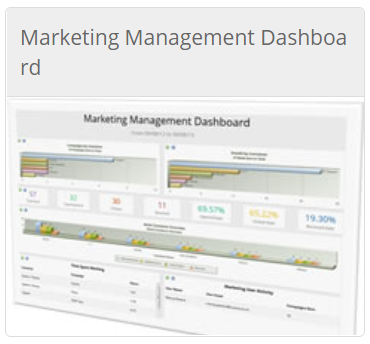
This dashboard looks at the overall activity of your Vuture instance or container. It shows the total number of emails sent by each container, the number of recipients that have received emails from each container. Then it also shows the overall amount of time each user has spent working and the number of campaigns they've sent.
Click here to find out more about this dashboard.
Business Development Dashboard - Individual
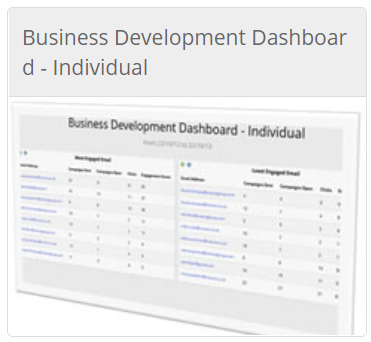
This dashboard shows the individuals who have engaged the most, the least, those contacts who have increased their engagements and also those who have decreased their engagement.
Click here to find out more about this dashboard.
Business Development Dashboard - Company
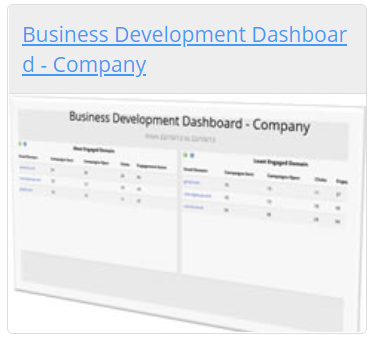
This dashboard shows the most and least engaged company. The company whose engagement has increased over time and those whose engagement has decreased over time.
Click here to find out more about this dashboard.
Bouncebacks Dashboard
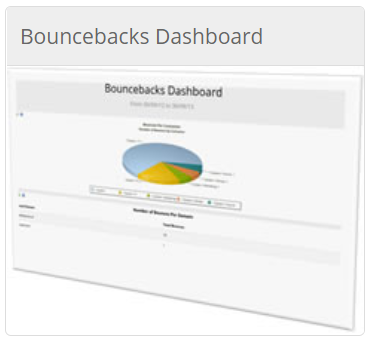
This dashboard shows the number of bounces by container, the domains that have had the highest bounces and also those contacts who have bounced most recently. If you want to know the difference between a hard bounce and a soft bounce click here.
Click here to find out more about this dashboard.
General System Statistics
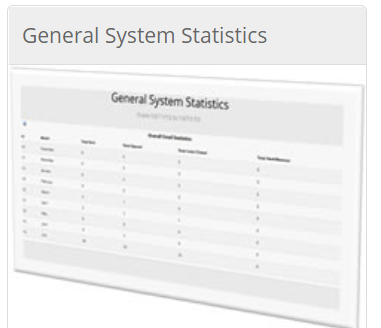
This dashboard shows you totals and averages per month for all of the emails that you send through your Vuture instance.
Click here to find out more about this dashboard.
Additional Dashboards
Some of these dashboards are enabled when you have the relevant feature or module enabled in Vuture. Please speak to your account manager if you want to find out more about the feature.
Premium Company Activity Dashboard
This dashboard requires the Web Tracking to be enabled. To find out more about Vuture's web traffic please click here.
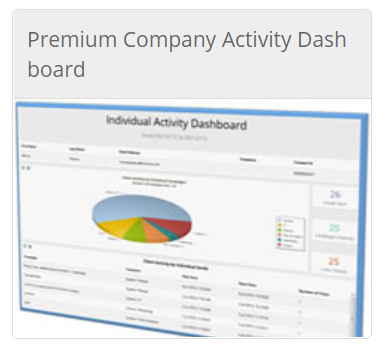
This dashboard is the same as the company activity dashboard but also includes web traffic for each company. Click here to find out more about this dashboard.
Premium Individual Activity Dashboard
This dashboard requires the Web Tracking to be enabled. To find out more about Vuture's web traffic please click here.
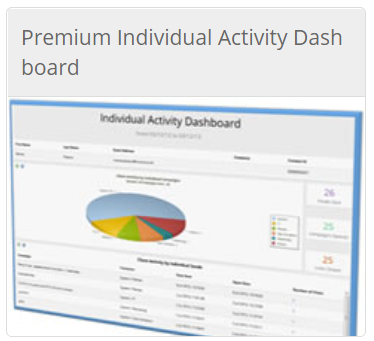
This dashboard is the same as the Individual activity dashboard but also includes web traffic for each individual. Click here to find out more about this dashboard.
Engagement Scoring Dashboard
This premium dashboard requires Engagement scoring. To find out more about engagement scoring please click here.
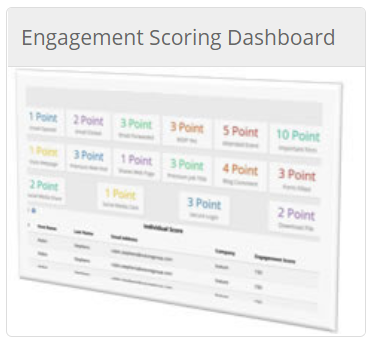
This dashboard allows you to create lead or engagement scoring and view them as engagement trackers.
Web Leads Dashboard
This dashboard requires the Web Tracking to be enabled. To find out more about Vuture's web traffic please click here.
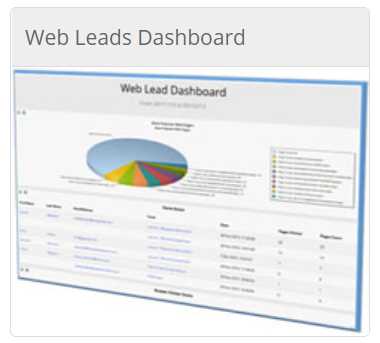
This dashboard shows the most popular web pages you are tracking along with the most recent form completions and identified visitors to your site. Click here to find out more about this dashboard.