Overview
This dashboard shows an overview of a specific company's activity. This is useful if you want to see how the individuals from a specific company (i.e. key clients or prospects) engage with your email communications.
This dashboard will show you:
- All emails that were sent to this company in the time-frame that you set (i.e. last 6 months);
- How many of the emails individuals at this company opened;
- How many links clicked they generated;
- What percentage of emails that were sent to this company came from what container and the total # sent from each container;
- The exact emails that were sent to individuals at this company, what container they were sent from, the date sent, who at this company was sent the email and who opened the email, as well as, what links were clicked (if any);
- A list of contacts at this company ordered by their Engagement Score, which displays the most engaged contacts (i.e. more opens and clicks) at the top of the list;
- The best time to send to this company based on historic opens;
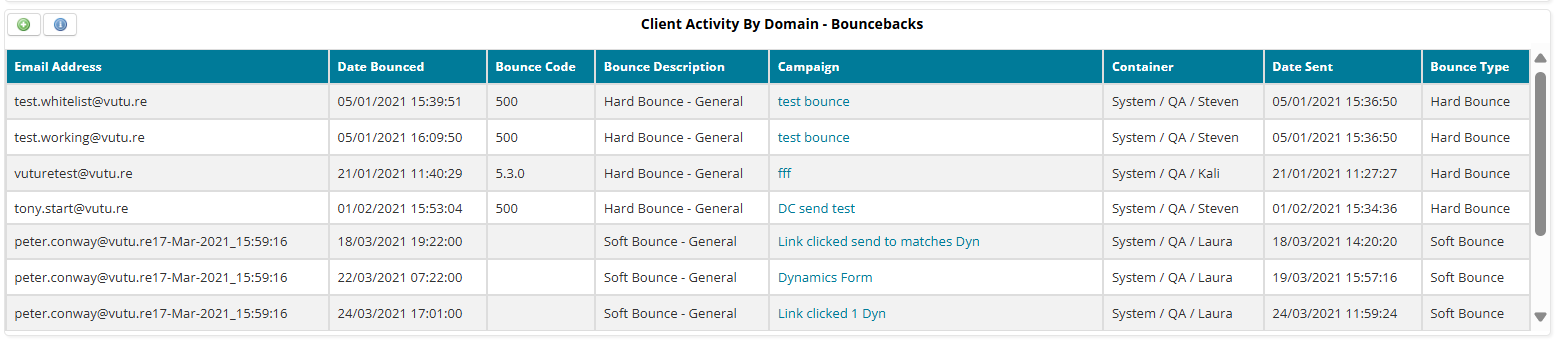
- New for 2025 - the bouncebacks created across company emails.
Contents
How to use this Dashboard
To analyse how a key company is engaging with your email communications, please follow the below instructions:
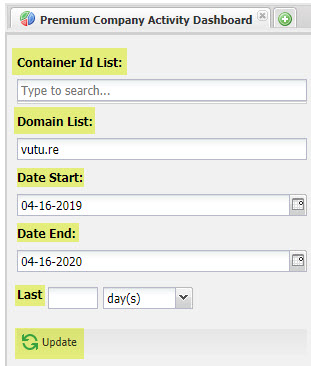
Container Id List: If you leave this blank, by default, the Dashboard will display the five most popular containers for this key company. 'Popular' is defined as, the total number of emails sent from those containers to this company.
Optional - If you'd like to focus on specific containers for this key company, you can click into the 'Container Id List' field. This will open a pop-up where you can select up to five containers to analyze. If you select more than five, the additional containers (with less send data to this company), will be coupled together into one part of the pie chart within the 'Client Activity by Individual Emails' report (more on this below).
Domain List: Type in the key company's domain into the 'Domain List' field (i.e. 'google.com').
Optional - You may also include a list of company domains to see all data combined into this one dashboard. To do this, separate each domain with a comma and no space (i.e. Vutu.re,TJMaxx.com,Marshalls.com) in the Domain List field.
Time/Date Options: By default, the 'Date Start' and 'Date End' will reflect the last year from today's date. You may click on the calendar icon to select a new 'Date Start' and 'Date End'.
Or, you may select the Last # of day(s) or month(s), instead of choosing a 'Date Start' and 'Date End', to select the date-range you wish to see data on for this key client/prospect.
Once you have finished setting your parameters to view this Dashboard for your key company, click 'Update'.
Reports in this dashboard
After you've clicked 'Update', you should see the full Dashboard load. This section of the Help Desk article will run through each section of the Company Activity Dashboard from top to bottom.
Please note, throughout this Dashboard, you'll see little green '+' icons in the top left corner of each section. If you click on the green '+' icon, it will open up a detailed report for you to then be able to export to a CSV file. Within the detailed report, you will see 'Export as a CSV' on the left side of the screen.

Client Activity by Domain Emails Sent
(53: Client Activity by Domain - Result Overview)
This section shows the total number of emails sent to that company from each container in the time-frame that you set.
The report includes the number of email sends per container for the domains and date range selected. A send is counted each time someone clicks the send button and this includes using the send more button on an already sent email.
For example, if a user sends an email and then does 3 send mores this will show a count of 4.
In the example below, we can see that 863 emails were sent to this company in total. Of that total, 553 of the emails were opened and 570 links were clicked by individuals at this company.
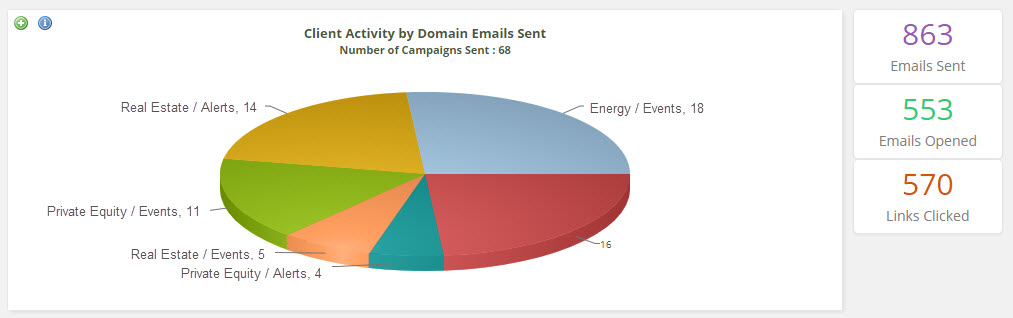
In the pie chart above, we can also see a break down of the types of emails that were sent to this company, based on how you've setup your container structure.
Setting up your container structure by 'Practice Area' or 'Department' (i.e. Energy or Real Estate), as well as, 'type of Mailing' (i.e. Events or Alerts), gives you a better understanding of the company's interests. It may also allow you to identify new business opportunities. For example, if you are targeting a company on 'Private Equity', but you see that the individual is engaging more with 'Energy' related communications, you may wish to adjust your focus.
Please note, When you click on the green '+' icon to drill down into this report you go to the following report - 92: Client Activity by Domain - Campaigns by Container Full Results.
Client Activity by Domain - Individual Sends
(50: Client Activity by Domain - Individual Sends)
This section shows the exact emails that were sent to this company in the time-frame that was set, which container the email was sent from, and the date sent. You are also able to see the # of recipients who received a specific email from that company, and whether or not they opened or clicked the email. You can also see the who was sent the email, who opened the email, and what links were clicked by individuals at this company by clicking to the number.

Please note, When you click on the green '+' icon to drill down into this report you go to the following report - 101: Client Activity by Domain - Individual Sends - Full results.
Client Activity By Domain Client Activity Report
(117: Client Activity By Domain - Client Activity Report)
This section shows you a list of contacts at this company ordered by their Engagement Score, which displays the most engaged contacts (i.e. more opens and clicks) at the top of the list. The way the Engagement Score is calculated is that the individual receives 1 point for an open and 2 points for a click.

Please note, you may see a high click rate and low # of emails sent like in the example above for Laura. This is likely due to Laura forwarding the email on and her forwarded recipients clicking on links. The forwarded recipients clicks will write back to Laura's engagement. For this reason, we recommend encouraging your contacts to use the Forward to a Friend Form.
Company Best Time to Open
(125: Company Best Time of the Day to Open)
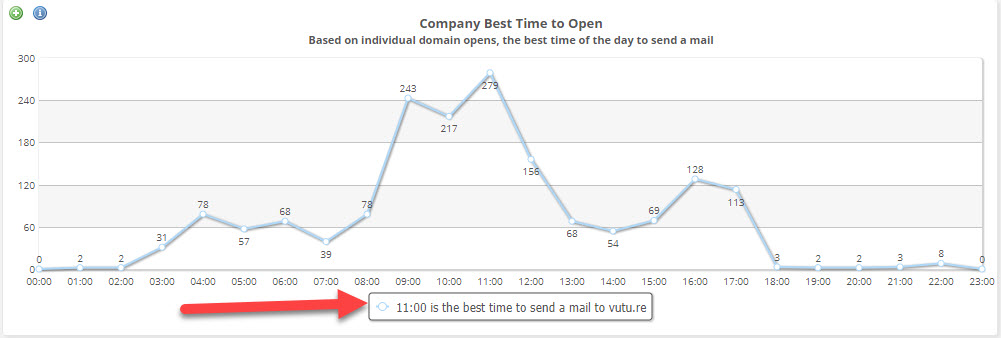
This section shows the best time of day to send to this company based on the historical opens for individuals at that company.
Bouncebacks
We have added a new "Client Activity by Domain - Bouncebacks" report to the Company Activity Dashboard and Premium Company Activity Dashboard.
The new bouncebacks report shows bounces by domain with hyperlinks to campaigns and detailed bounced contact info.