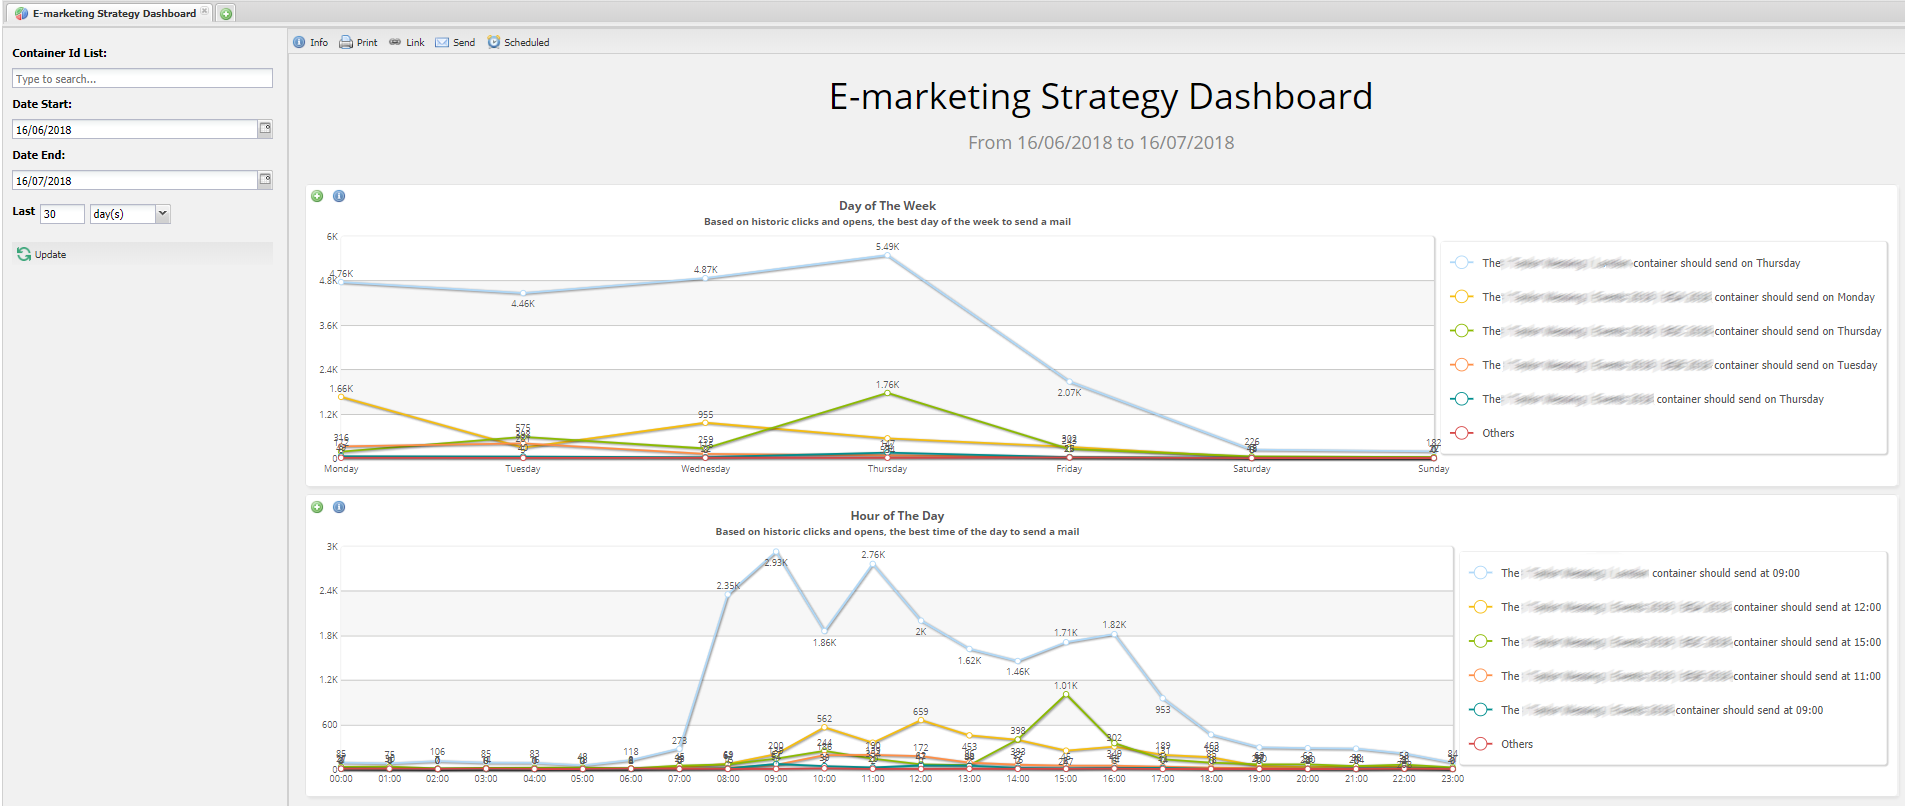
This dashboard shows you the day of the week and the hour of the day that has the most opens. It is filtered by container and can give you an idea of the best day and time to send your campaign.
This report will use the time zone of the Vuture user viewing the report.
You can send this dashboard to yourself or your colleagues either once or on a recurring basis. Find out how to do this here.
Filters
you can filter by
Container - using Container ID
Date Range
Reports
Day of the Week (55: Emarketing Strategy - Day of The Week)
This report uses historical clicks and opens each day to show you which day of the week is best for you to send your campaign. We break this down for you by container. If you click on the roundels you can show or hide specific containers.
When you drill down, the report you see is 84: Emarketing Strategy - Day of The Week Full Results
Hour of the Day (59: Emarketing Strategy - Hour of The Day)
This report uses historical clicks and opens the best hour of the day to send your email. We break this down for you by container. If you click on the roundels you can show or hide specific containers.
When you drill down, the report you see is 103: Emarketing Strategy - Hour of The Day Full Results
When analysing these reports bear in mind that most opens and clicks happen within the first hour of you sending your email. Use these stats as a guideline. If you need help to analyse what you see, get in touch with your Account Manager.