Overview
Email marketing can add significant value to your firm’s overall marketing and business development activities. Therefore it’s really important to make sense of the data and use it to identify what’s working and what needs to change, to help improve and develop future campaigns and client relationships.
Below you will see a list of frequently-asked questions we have gathered from our clients so far, to start this Help and FAQ section for Dashboards.
Contents
- How do I ensure that the most relevant contacts are on the list?
- In the run up to an event – who has accepted, who has forwarded to a colleague?
- Who, at my most important client company, is very engaged with us and who is not engaged at all?
- Who, at my most important client company, did and did not receive xyz mailing?
- After a newsletter mailing, whose email bounced, and what percentage of contacts mailed opened the email/read it/forwarded it/printed it?
- In the past six months, what added value have we offered to client company xyz? Note: added value is client training seminars, webinars, newsletters, legal updates, etc. and is hard to track normally.
- How has the overall engagement of company xyz varied over the past year? Is it increasing or decreasing over time?
- Have the read-rates increased since (an event or date in the past)?
Pre-Event
1. How do I ensure that the most relevant contacts are on the list and that they receive the mailing?
When you are pulling together an event list, it’s important to check the following points:
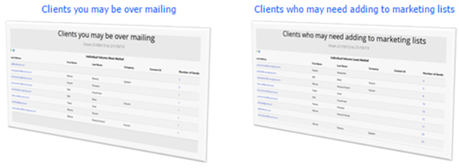
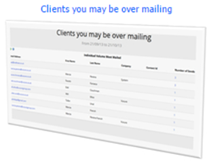
- Are there contacts who you have been over-mailing? This could be because they have moved company or role, or the content you are sending is irrelevant. Click into the Clients you may be over mailing Dashboard and look at the top contacts who are not opening your emails. Either update the details yourself in your CRM or send to the owner/sponsor of that contact to update. There is no use having incorrect contact details in a list as it will Hard Bounce, which over time will negatively impact your sending reputation, which can lead to clients not receiving mailings from your firm.
- Are there contacts you have been under-mailing? There could be contacts who are engaging with you regularly, but you continue to send them the same emails. You could be missing out on bigger opportunities by not including them on lists for other mailings. One option would be to reach out to those contacts so they can update their preferences or interests. Click into the Clients you may be under mailing (or, Clients who may need adding to marketing lists) Dashboard to see these contacts.
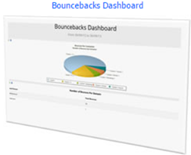
Another dashboard to check is the Bouncebacks Dashboard which will show you the top domains that have bounced from previous mailings. This is important to check regularly because spam filter sensitivity varies from one company to another. One possible solution for bouncing emails is to contact the contact's IT team directly and request that your emails are whitelisted. Otherwise, no individuals at that company will receive mailings from your firm.
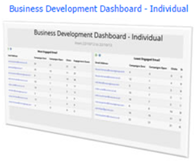
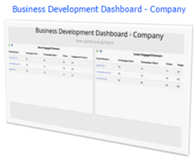
We would recommend also checking the Business Development Individual and Business Development Company Dashboards which provide you with a list of the most engaged and least engaged individuals and companies overall. Again, this is a good indication of data that might be incorrect or out of date, or there needs to be a change in the type of content being sent.
2. In the run up to an event – who has accepted, who has forwarded to a colleague?
Click into the Email Dashboard and search for the email you are trying to track. Here you will see who has forwarded and printed the email, top links clicked, forms and form fields completed (which will also give you a list of the RSVPs).
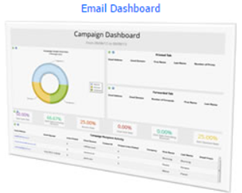
One thing to note is that you can schedule this Dashboard to arrive in the inbox of other team members and Partners, to keep them updated on the open rates and acceptances of clients and contacts ahead of an event, for example. You can set this up as a recurring report or a one-off and it will save you having to jump in and out of the system, as well as update others in the run-up.
Post Event
1. Who, at my most important client company, did and did not receive xyz mailing?
For a quick indication of companies which are not receiving your firm’s mailings, click into the Bouncebacks Dashboard where you can see the top bouncebacks by container or by domain. We would recommend tackling the top 10 domains that bounce to start with, as it’s likely these are companies that have especially sensitive spam filters.
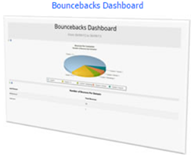
One possible solution to help ensure that these contacts receive your mailings, is to contact your client’s IT team with a request to whitelist your sending domain and address. Once whitelisted, all contacts at those firms should then be able to receive mailings from you.
The option of looking at bounces per container can often make it easier to send the bounces to internal contacts, so they can update or amend the contact information, ideally in your CRM directly.
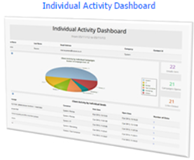
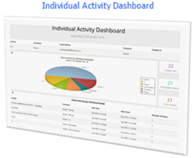
Another useful dashboard for managing data (which is often the cause for a large number of bouncebacks) is the Clients you may be over mailing Dashboard. This report pulls in the top contacts that you could be over mailing. You can then click on the individuals and it will take you directly to the Individual Activity Dashboard where you can view the number of emails sent compared with the number of emails opened. It’s a good indication of those contacts who might have moved or changed roles, for example.
If there are a small number of individuals that a particular Partner wants to know about, you can schedule a recurring Individual Activity Dashboard to appear in their inbox, with all the activity and engagement information on that individual contact.
2. Who, at my most important client company, is very engaged with us and who is not engaged at all? (This report would be useful for Partners).
Firstly, it’s useful to check which companies are really the most engaged overall by clicking into the Business Development Company Dashboard. This lists the most engaged companies (in terms of domains) and if you click through, it will display individuals in that company by order of engagement. It will also show you the companies who are least engaged.
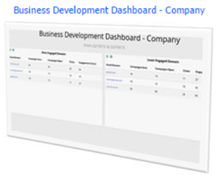
If, for example, none of the companies that are regarded as your most important are in the ‘Most Engaged’ list, then something needs to change. This could be due to incorrect contact information, the type of contacts in the lists, or the type of content being sent to these contacts.
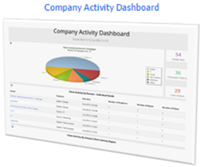
The next step would be the Company Activity Dashboard where you can enter a domain name and view who the most engaged individuals are at a specific company. You can view which emails they have engaged with the most, which helps you to see what content works and doesn’t work.
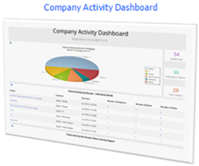
Both of these Dashboards can be scheduled to be sent to the relevant Partners, every week for example, to show them the companies who are engaging the most and the least overall.
3. After a newsletter mailing, whose email bounced, and what percentage of contacts mailed opened the email/read it/forwarded it/printed it?
Click into the Email Dashboard to see the overall number of bounces for that email, open rates, click rates and the number of times the email has been forwarded or printed as well as the forms and values submitted. This is displayed as a number and as well as a percentage.
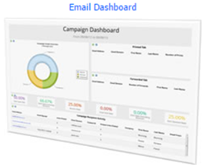
You can schedule this Dashboard to be sent to the relevant team members and Partners following the event, so they have the information at a glance straight away.
Review (ongoing, throughout the year)
1. In the past six months, what added value have we offered to client company xyz? Note: Added value is client training seminars, webinars, newsletters, legal updates, etc. and is hard to track normally. (This report would be useful for Partners or Head of Marketing/BD).
Click into the Company Activity Dashboard, type in the domain name of the company you wish to track and set the dates to suit the time period. You will see all the emails sent to them, which individuals were the most engaged and which emails had the highest open rate. If you click on the actual email that was sent, you will be able to see the individual activity for that particular email.
If you have a ‘VIP’ list of individuals, the Individual Activity Dashboard can be used in the same way as this one and will enable you to see everything for that individual.
These activity dashboards will provide a clearer picture of the type of content companies or individuals are interested in, who at that company is the most or least interested and which type of emails have worked best or not (which should help to steer the content or format of emails for future campaigns).
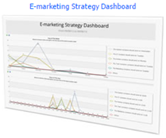
It’s also worth looking at the Email Strategy Dashboard which shows you open rates and click-through rates, across containers. You can then see which containers (usually named by sector, department or practice area) are sending the most effective emails, and you can use those emails as an example to help other departments increase their rates.
2. How has the overall engagement of company xyz varied over the past year? Is it increasing or decreasing over time? (This report would be useful for Partners).
Click into the Company Activity Dashboard and for each month, record the overall number of links clicked and emails opened for the month. Then insert into Excel to create a chart to see whether it has increased or decreased over time. To prepare for the following year, schedule the report monthly so that you can start collating the data in an Excel document.
3. Have the read-rates increased since (last year or any event or date in the past)? (This report would be useful for the Head of Marketing/BD).
Click into the Company Activity Dashboard. Scroll down to see the Engagement Score by Individual. This demonstrates the individual engagement level at your client company.

Alternatively, use the BD Individual Dashboard to see Engagements scores. Change the reporting dates to see at a glance if the Most and Least Engaged numbers have changed, following alterations in your BD behaviour (such as new templates, emailing at different times, etc.)

To view the full range of Dashboards, along with a description of what you can find, please click here.
If you have a question around reporting, and need help finding the most effective way to pull off the data you need please contact your Customer Success Manager.