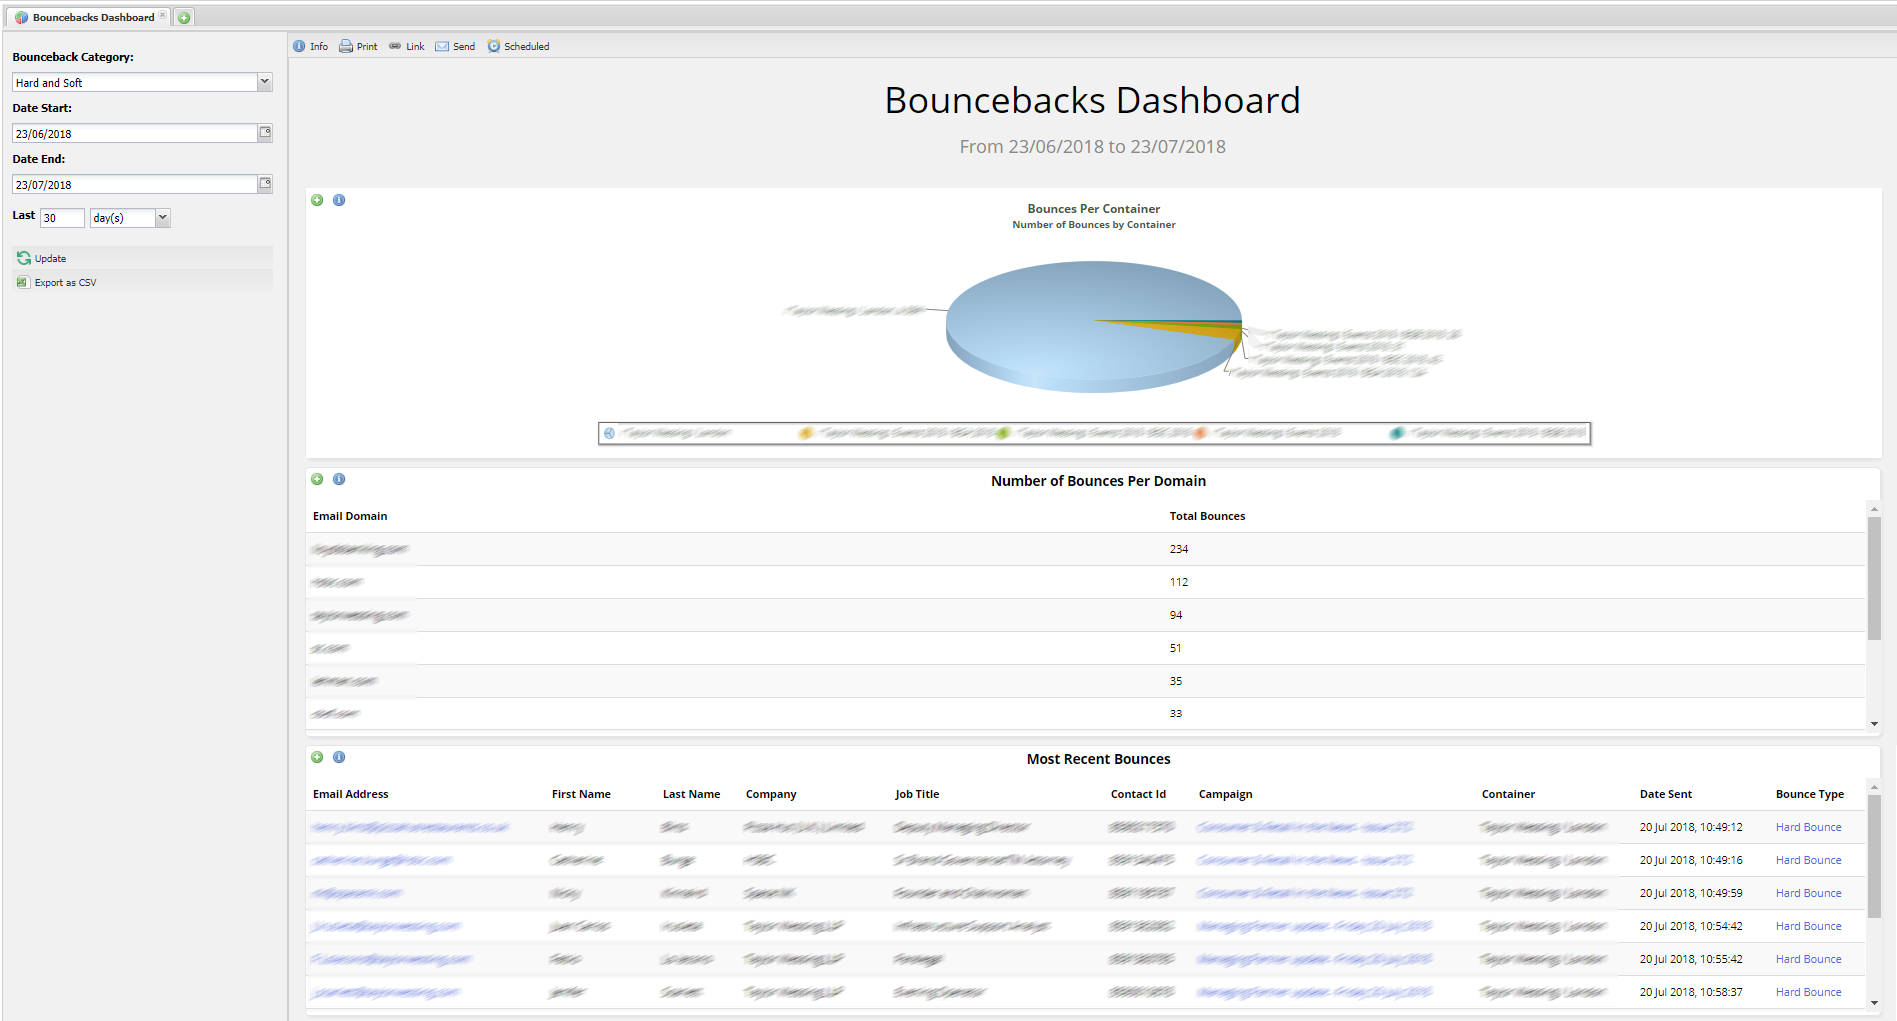
This dashboard shows you the bounces you have received over the given time frame.
You can send this dashboard to yourself or your colleagues either once or on a recurring basis. Find out how to do this here.
Filters
You can filter this report to show both hard and soft bounces or just the one
You can filter by date range
Report in this dashboard
Bounces per container
Report number 123: Bounces Per Container
This report shows you the total number of bounces from each container as a pie chart.
When you drill down into this report you get to: Report number 127: Bounces Per Container Full Results
Number of bounces per domain
124 Bouncebacks Dashboard Bounces Per Domain
This report shows you the total number of bounces per domain. This will typically highlight the domains you send to the most but may show some anomalies. If you see a domain here with a very high number of bounces. It's worth investigating futher.
When you drill down into this report you get to: 131 Bouncebacks Dashboard Bounces Per Domain - Full Results
Most Recent Bounces
126 Last Bounces Table
Irrespective of the data range that you select from the filter menu this report will show you the most recent bounces across all the containers as well as the type of bounces.
When you drill down into this report you get to: 128 Last Bounces Table - Full Results