Overview
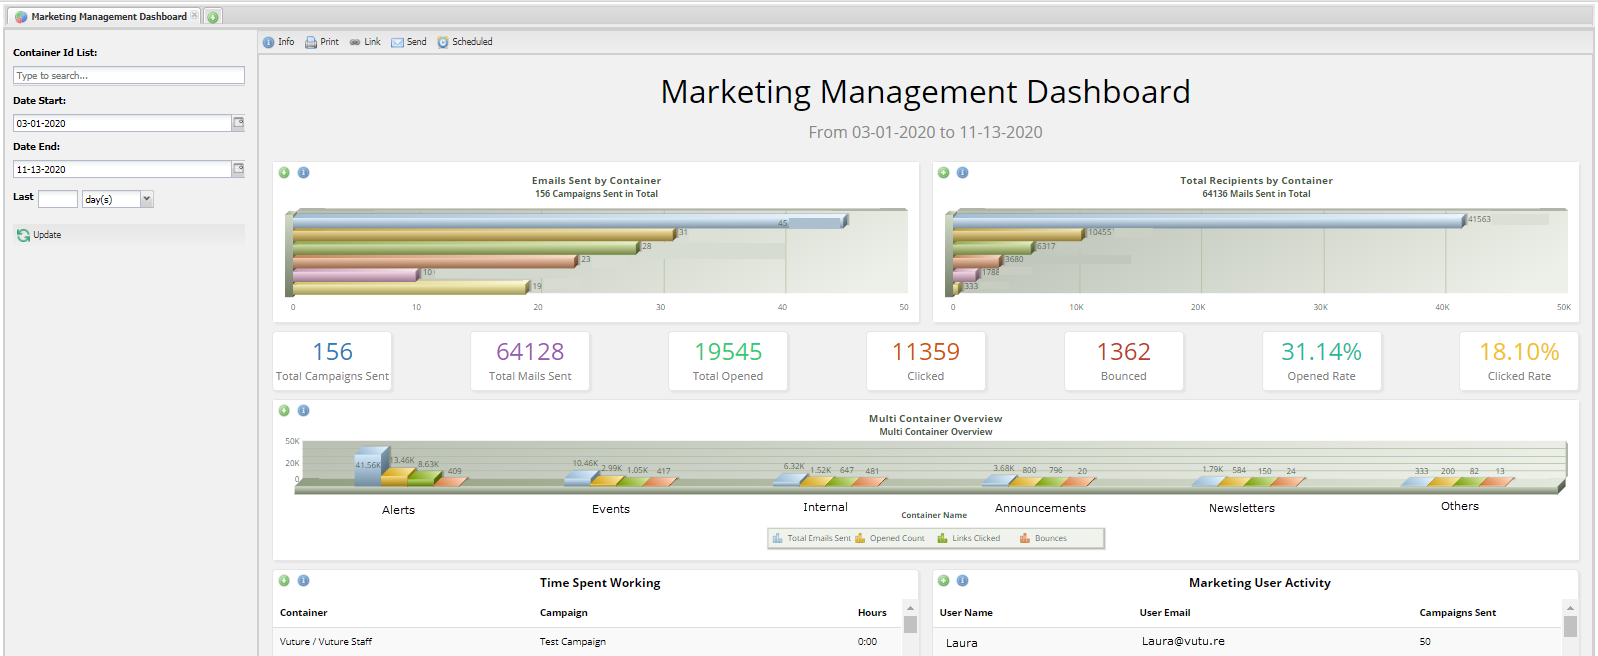
This dashboard looks at the overall activity of your Vuture instance or container(s). It shows the total number of emails sent by each container, and the number of recipients that have received emails from each container. Then it also shows the overall amount of time each user has spent working and the number of campaigns they've sent.
By default, this dashboard will show you the six most popular containers. Popular is defined as the number of emails sent from that container.
Important: This dashboard relies on the Vuture's email data aggregation task which must be running for all fields to be populated. This should be setup by default but the setup can be checked by Vuture support - see this article for details
You can send this dashboard to yourself or your colleagues either once or on a recurring basis. Find out how to do this here.
Filters
You can filter by date range and by container.
Reports in this dashboard
Emails sent by container
(54: Marketing Management - Emails Sent by Container)
This report shows the total number of emails sent, by each container
Please note, when you click on the green '+' icon to drill down into this report you go to the following report 262: Campaigns By Container Full Results - Exclude Domains
Total Recipients by container
(60: Marketing Management - Total Recipients by Container)
This report shows the total number of contacts emails have been sent to from each container.
Please note, when you click on the green '+' icon to drill down into this report you go to the following report 263: Emails by Container Full Results - Exclude Domains
Totals
(67: Marketing Management - Total Averages)
These reports show totals for the given period and container(s):
- Total Campaigns Sent - The number of unique emails that were sent inside the campaigns.
- Total Mails Sent - The total number of emails sent.
- Total Opened - The total number of email opens.
- Clicked - The total number of clicks in an email.
- Bounced - The total number of bounces.
- Opened Rate - The number of emails opened, divided by the total number of emails successfully delivered (i.e. not including bounces), expressed as a percentage. (Total # Opens) / (Total Mail Sent - Bounced) * 100.
- Clicked Rate - The total number of clicks divided by the total number of emails successfully delivered (i.e. not including bounces), expressed as a percentage. (Total # of clicks) / (Total Mail Sent - Bounced) * 100.
Multi container overview
(76: Marketing Management - Multi Container Overview)
This report shows the totals opens, clicks and bounces for the given period of time.
Please note, when you click on the green '+' icon to drill down into this report you go to the following report 106: Marketing Management - Multi Container Overview Full Results
Marketing user activity
(63: Marketing Management - User Activity)
This report shows how many emails each user has sent in the given period time.
Time spent working
(78: Marketing Management - Time Spent Working)
This report shows how long each campaign has taken to be put together.
FAQ
1. Why am I seeing "Wizard Send" under the Marketing User Activity section of this Dashboard?
The "Wizard Send", represents any mailings that were sent either by the Scheduled Email Send Dashboard from the Email Send Screen or by clicking on the "Send icon" directly from the Dashboard.