The Peer Review benchmarking dashboard uses your organisation's email averages to benchmark these stats against other clients in your sector. It uses aggregated, anonymous data for all clients participating in the program.
You do need to opt in to the program to view the stats. If you can't see the stats and want to join please contact your Customer Success Manager. They will opt you in at "Admin.System.Metrics Configuration.Benchmarking Opt In" and select a benchmarking category for you using "Admin.System.Metrics Configuration.ClientCategory". They will also check the Roles at your firm to ensure the right Roles have access to these reports.
The results are available securely within your own instance through the Peer Review Benchmarking Dashboard. This Dashboard can be enabled for any Role using "Admin.Roles.Dashboards.Benchmarking Dashboard".
If you have not yet opted in to the program you will see only sample data in the reports.
Benchmarking is updated twice yearly in July and January for the previous 6 months. If you opt-in part way through a six month period you will be able to see the historic benchmarks but your aggregate data will not be included until the next update.
The Peer Review Benchmarking Dashboard includes 4 tabs covering Engagement, Sending Volumes, Email Clients and Email Type:
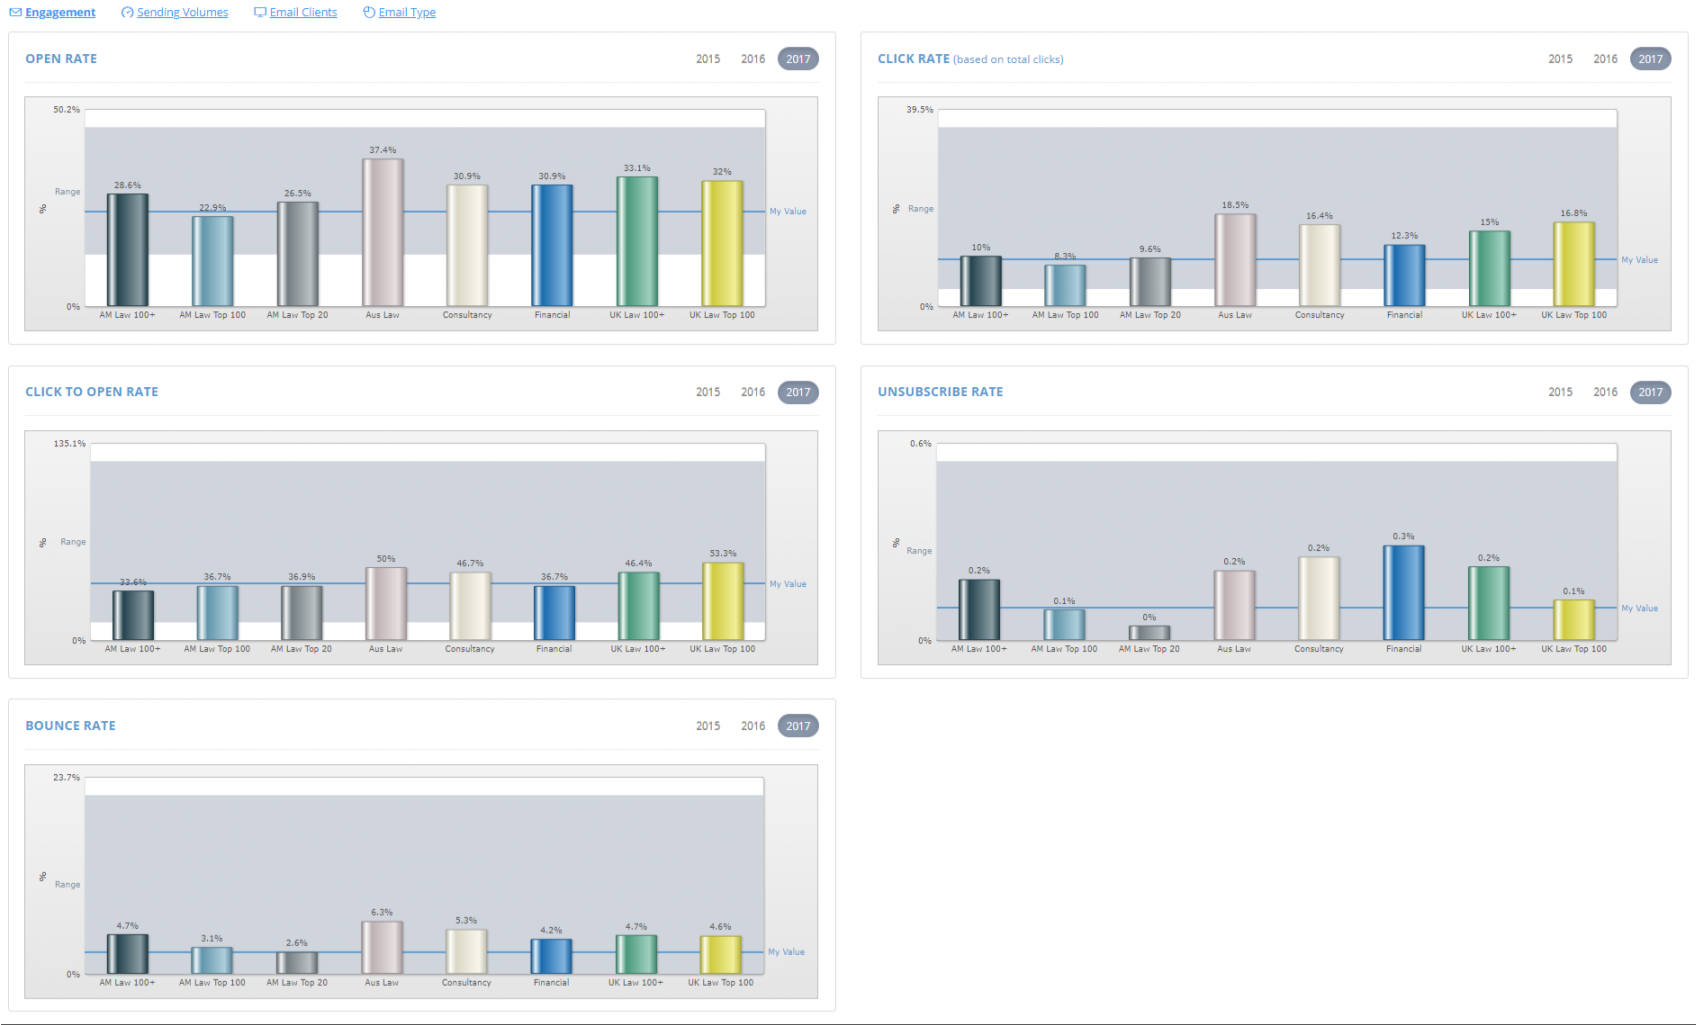
Engagement
- Open Rate
The number of emails opened divided by the total number of emails successfully delivered (i.e. not including undeliverables), expressed as a percentage.
- Click Rate
The total number of clicks divided by the total number of emails successfully delivered (i.e. not including undeliverables), expressed as a percentage. Clicks counts all clicks including unsubscribe links and view online links.
- Click to Open Rate
The total number of clicks divided by the total number of opens, expressed as a percentage.
- Unsubscribe Rate
The total number of unsubscribes divided by the total number of emails successfully delivered (i.e. not including undeliverables), expressed as a percentage. - Bounce Rate
The total number of hard bounces divided by the total number of emails successfully delivered (i.e. not including undeliverables), expressed as a percentage.
Sending Volumes
- Monthly Emails Sent
This is the total number of contacts mailed on average each month. If a contact has been mailed more than once each email is counted in the total. - Monthly Number of Mailings
This is the average number of email sends each month. If the same email is resent using Send More this counts as a mailing. Since 2023 this number no longer includes sends to 0 contacts (since recurring triggered sends were skewing the numbers). - Monthly Unique Contacts Mailed
This is the average number of unique contacts mailed each month. If a contact has been mailed more than once then they are only counted once. - Monthly Average Mailing Size
This is the average mailing list size. - Monthly Mailings per Contact
This is the average number of mailings each contact is receiving per month
Email Clients
This shows, for each firm type, the percentage of their mailings opened by different email clients:
- Outlook
- iPhone
- iPad
- Blackberry
- Android
- Webmail (i.e. opened through the browser)
- Lotus Notes
- Unknown
Email Type
This shows, for each firm, the type of emails being sent, categorised by:
- Events Mailings
- Publications Mailings
- News Mailings
- Survey Mailings
- General Mailings
These are based on the Email Type you choose when sending. We have matched your email types into one of the five categories above.
Client Benchmarking Categories
The current categories are:
- AM Law 20
- AM Law 100
- AM Law 100+
- Can Law (Canadian Law Firms)
- UK Law 100
- UK Law 100 +
- APAC Law
- Consultancy
- Financial
We update the data twice a year. We aggregate and anonymise the data within your own instance. After this we send the anonymised data to our data centre. Here we combine all the opted in clients' data and create the benchmarks.
These regional benchmark data sets are combined into the final report by Vuture in the UK and made available to participating clients in a secure area of your platform.
Benchmarking FAQ
1. Is the data fully anonymised or pseudonymised?
The data is fully anonymised and no data points that identify a contact or company are included. Data points need to have data from a minimum of 2 clients to be included.
2. What are your processes or routines for generating the benchmarking figures?
The process is automated and the anonymisation is carried out in the local data centre. Final aggregation takes place securely in the UK.
3. How long is data held for?
We plan to compare the anonymous, aggregated data year on year so we would anticipate holding this data for at least three years but this could be modified based on client feedback.
4. Who else do you share it with?
The data is only shared with clients who have signed up to the benchmarking program. It is shared securely through their Vuture instance.
5. Can I opt out of the benchmarking program if I have opted-in but change my mind later on?
Yes you can. Your data will be removed from the next update and you will no longer have access to the benchmarks in your instance.
6. How are participants notified that new benchmarking data is available?
Benchmarking data is updated twice per year. Participants will be notified by their Customer Success Manager that new data is available.
7. How often do you update benchmarking categories and do you plan to breakdown the top 100 listings, e.g. top 50?
Choice of benchmarking category is made by your Customer Success Manager in your system.
Based on client feedback we may consider a more granular or alternative breakdown.
8. My firm has opted in but I am seeing our firm data (My Value) displayed as zero in the benchmarking reports. I am seeing this:
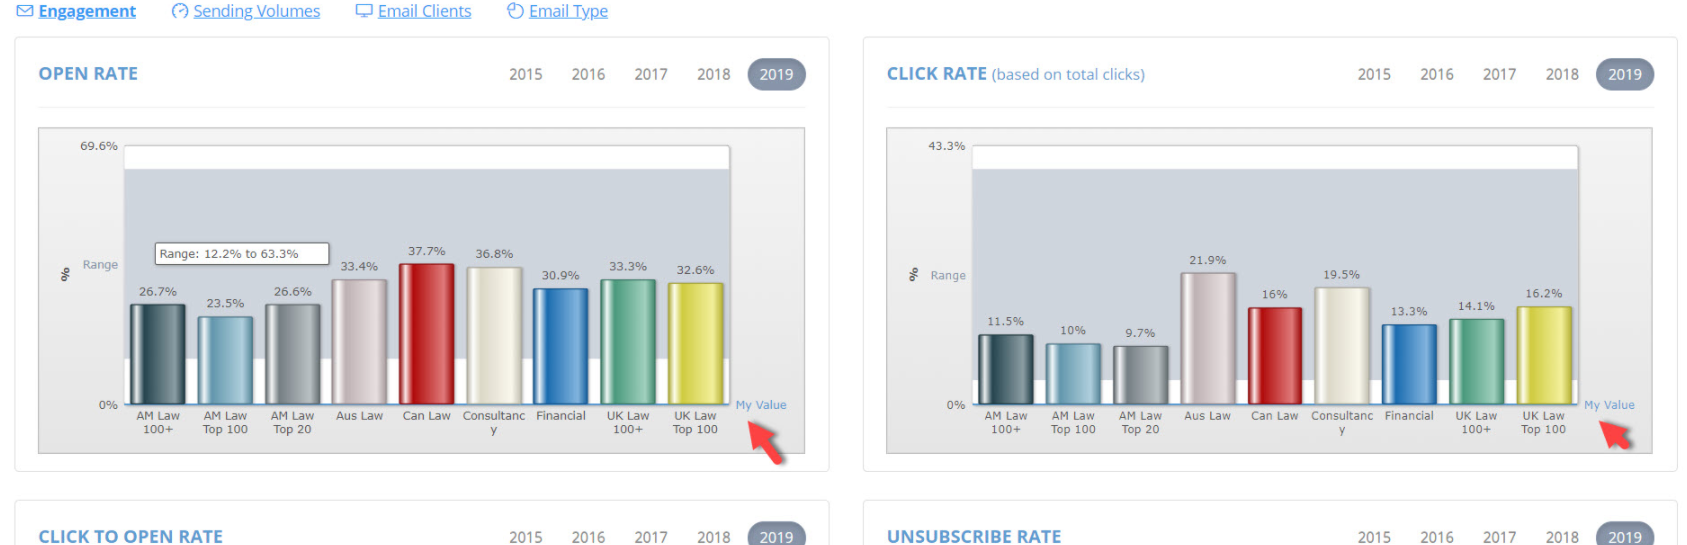
This is because you have opted in part way through the process. Benchmarking data is currently updated twice a year, in January and July.