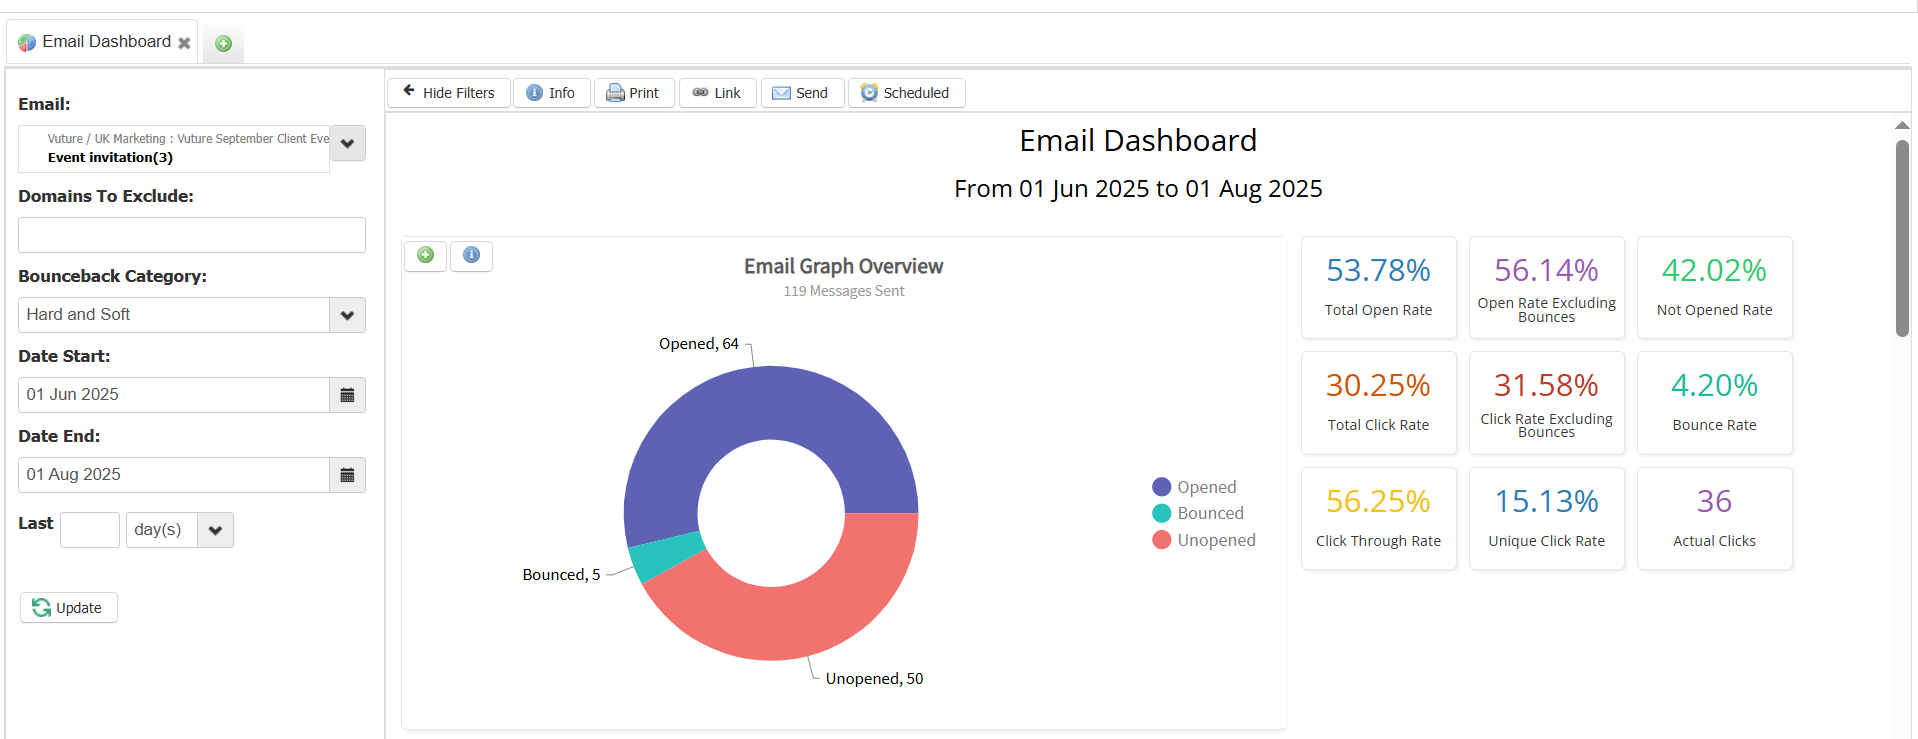
This dashboard gives you an overview of the activity for a specific email.
You can send this dashboard to yourself or your colleagues either once or on a recurring basis. Find out how to do this here.
Filters
When you open this dashboard you'll need to select a sent email from the menu on the left hand side.
You can exclude specific domains from this report. We recommend using this to exclude your own domain from the results so that you don't skew the results.
You can select a time frame to filter the results.
You can also filter the data using hard bounce, soft bounce or both.
Update: We have updated the look and feel of the Dashboard, reordered some of the information (the tab percentages on the right side for example) and made it possible to close temporarily the Filters area on the left - to allow you to take better screen shots for your presentations. Use the arrow next to the Hide Filters button to close or open the Filters area.
Below is a breakdown of each report in the dashboard and what the data shows. The number and name in brackets in each title is Vuture's reference.
Sometimes the reports displayed in the dashboards are a summary or show only the top/bottom. If you click on the green plus on the top left of any report you can drill down to view a table with more data.
Reports in this dashboard
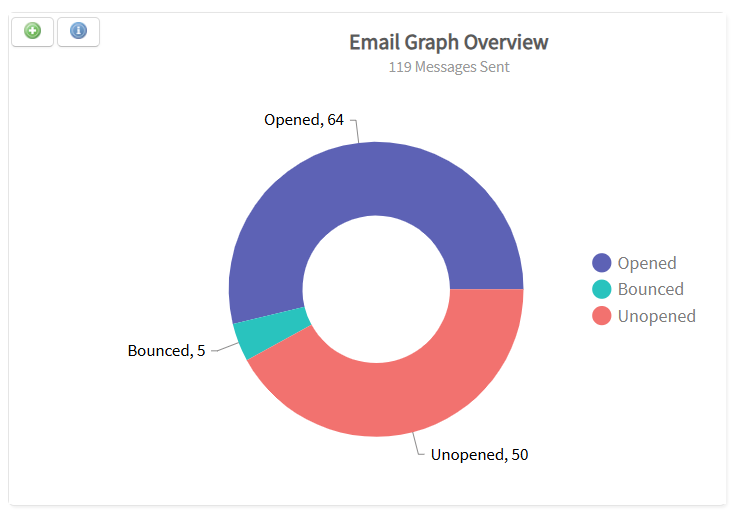
Email Graph Overview (73: Email – Email graph overview)
This report shows a donut chart of the number of recipients who have bounced, opened and not opened the email.
When you drill down, the report you see is: 73: Email - Email Graph Overview
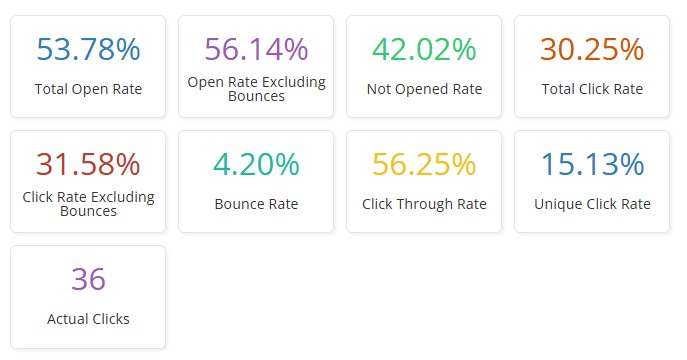
High level stats (75: Email - Email Overview)
These high level numbers show you the overall email stats for this email in percentages.
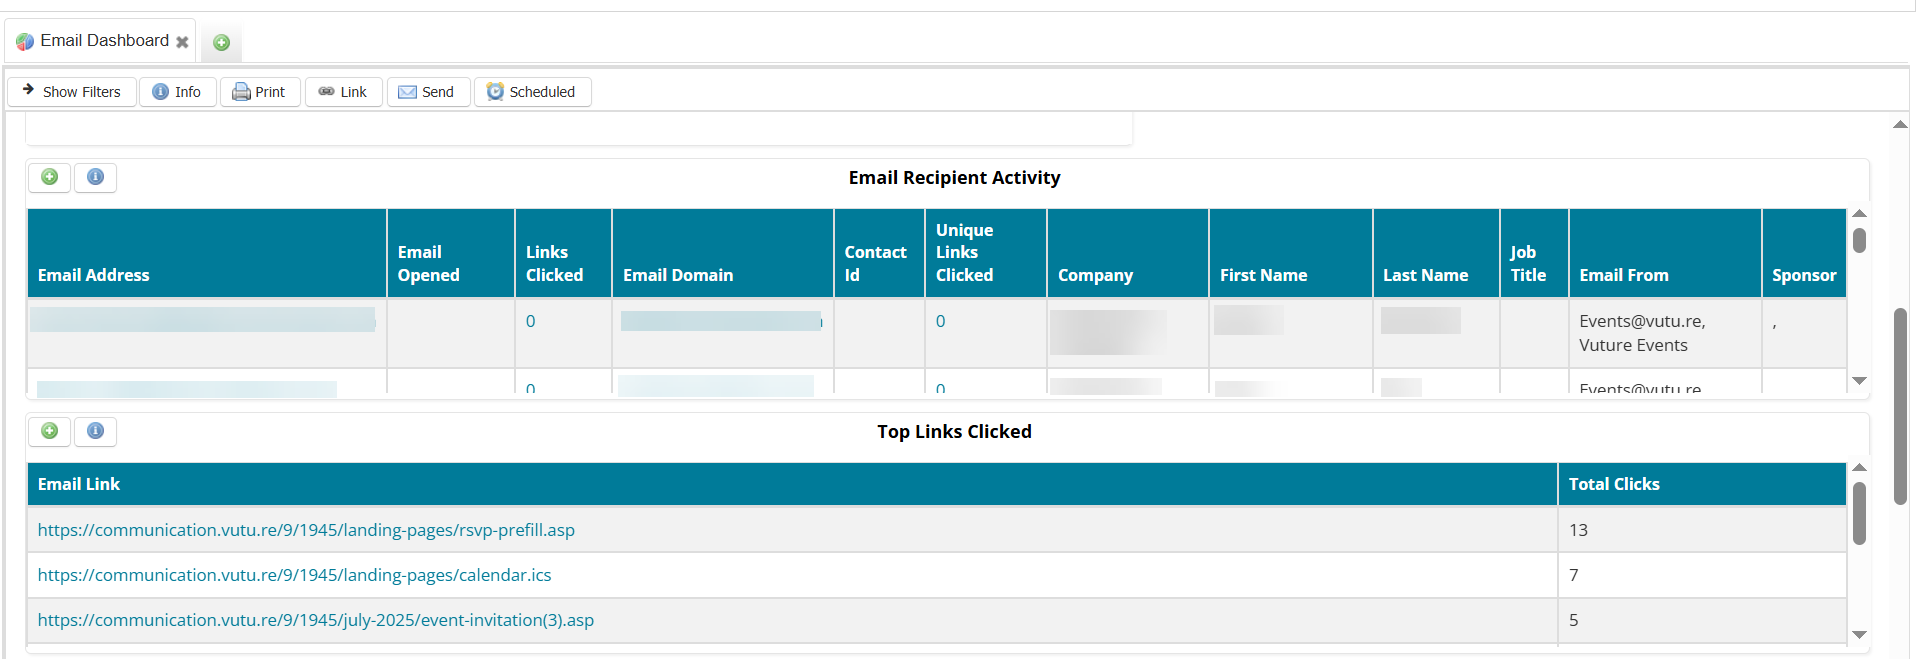
Email Recipient Activity (66: Email - Recipient Activity)
This report shows what every recipient has done with the email
When you drill down, the report you see is 66: Email - Recipient Activity
Top links clicked (3: Top Links Clicked)
This report shows the top links that were clicked in this email in order of the number of clicks.
When you drill down, the report you see is 3: Top links clicked
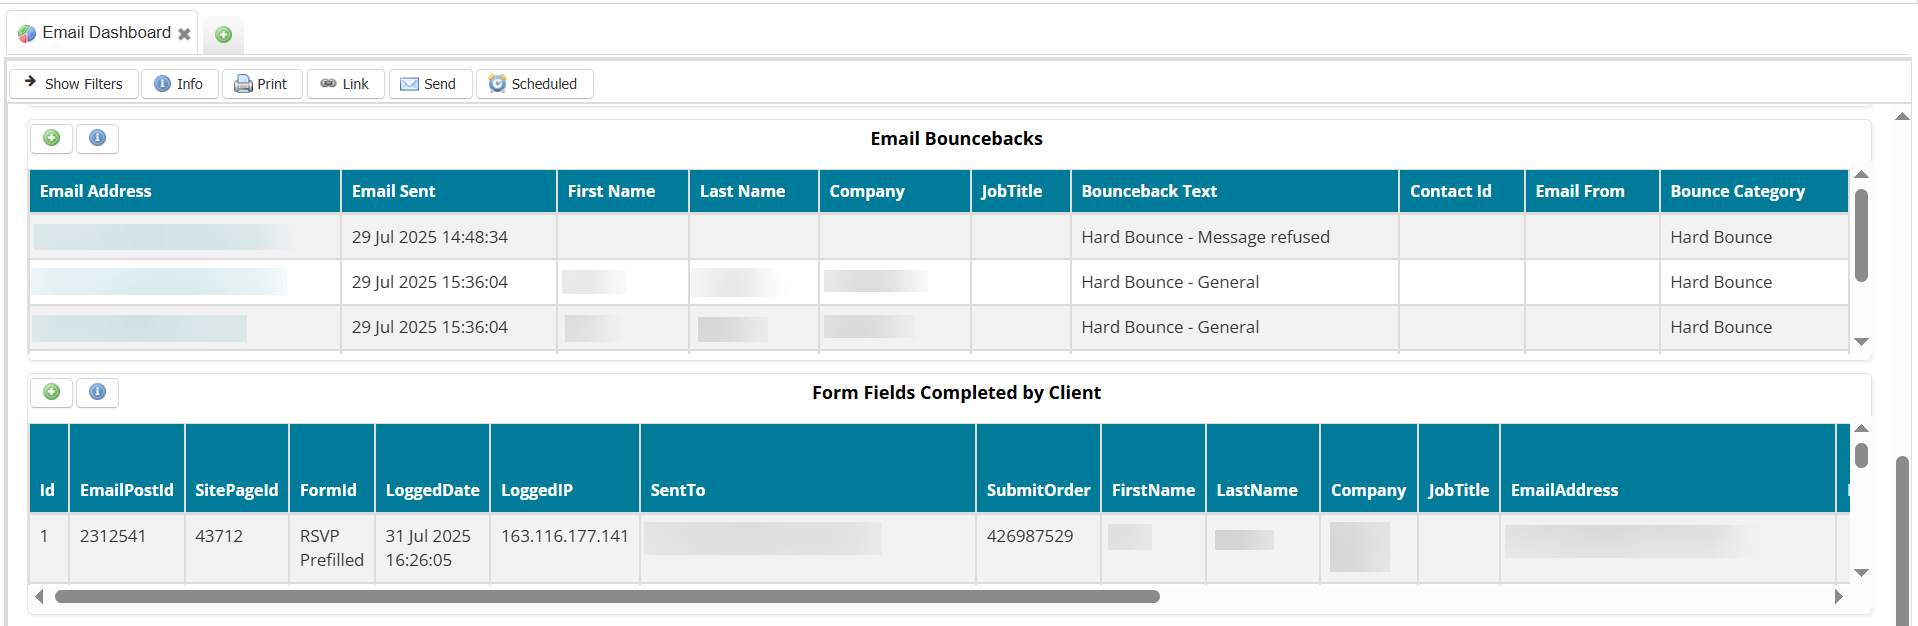
Email bouncebacks (68: Email - Email Bouncebacks)
This report shows the recipients who bounced in this campaign. It gives further information about the contact, their company along with the details of why they bounced.
When you drill down, the report you see is 68: Email - Email Bouncebacks
Form fields completed by client (57: Email - Form Fields Tab)
This report shows you the contacts that completed a form within this email.
When you drill down, the report you see is 57: Email - Form Fields Tab
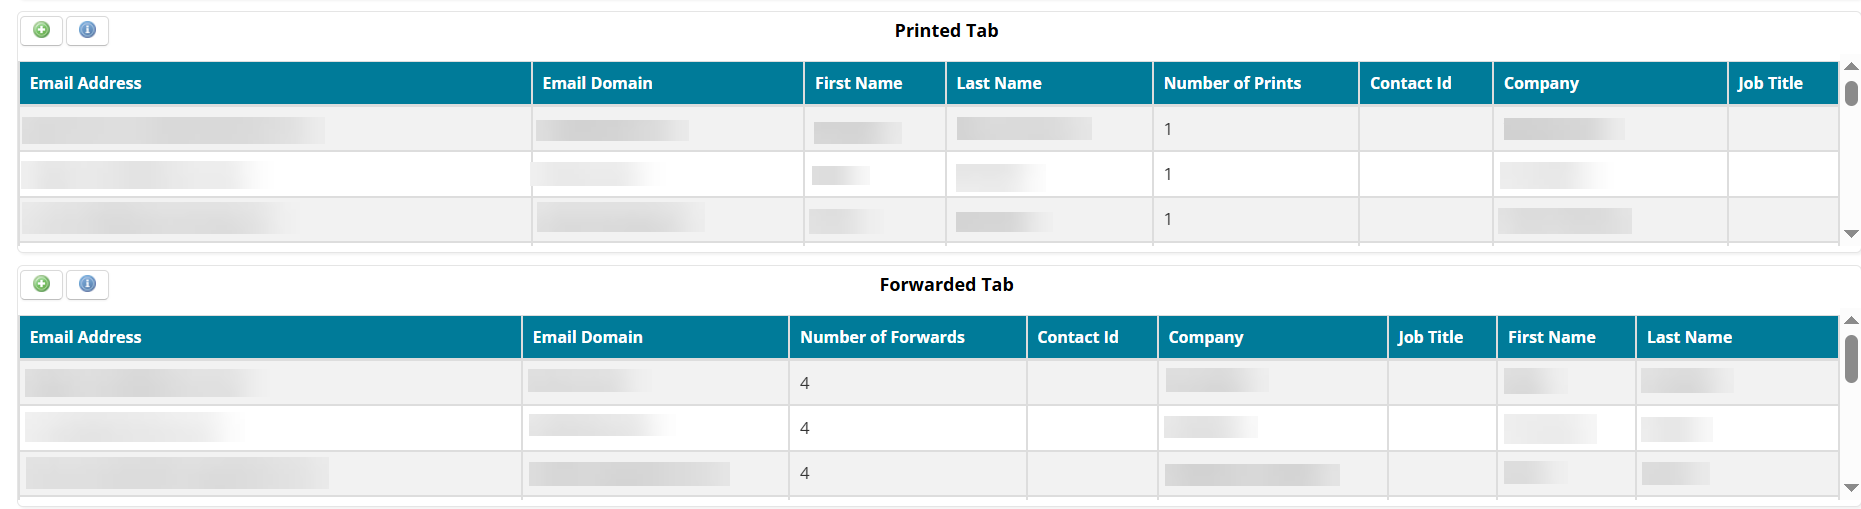
We have moved the Printed and Forwarded reports to the foot of the page since they are less helpful or reliable as metrics for the success of your mailing.
Printed Tab (56: Email Printed Tab)
Where possible this report shows any contact that has printed the email. A very small number of email clients allow this.
When you drill down, the report you see is 56: Email – Printed Tab
Forwarded Tab (62: Campaign - Forwarded Tab)
This report captures Forwards when using the Forward button within your email system (e.g. if I press Forward on my iPhone). Not all email clients allow capture of this information, but where it is possible we are capturing the data.
When you drill down, the report you see is 62: Campaign - Forwarded Tab