Detail for Business Development Dashboard - Company
The Business Development Dashboard - Company shows how your clients are engaging with your email campaigns from a per domain (company) perspective. It is made up of 4 individual reports. The way the data is generated for each report varies in order to allow them to handle large amounts of data. You can find more detail below.
For each of the 4 reports there follows a description of how each column is generated:
Most Engaged Domain
Data is ordered by: Engagement in descending order
Emails Sent: number of emails sent for each domain, in the selected date range
Emails Opened: number of emails opened for each domain, in the selected date range - based on the figure in tblEmailSent (EmailOpened)
Clicks: number of links clicked, in the selected date range
Engagement Score: Engagement score of all link clicks.
Least Engaged Domain
Data is ordered by: Engagement in ascending order, CampaignsSent in descending order.
Emails Sent: number of emails sent for each domain, in the selected date range
Emails Opened: number of emails opened for each domain, in the selected date range - based on the figure in tblEmailSent (EmailOpened)
Clicks: number of links clicked, in the selected date range
Engagement Score: Engagement score of all link clicks.
Increased Engagement Domain
Data is ordered by: Difference in descending order.
Annual Average Engagement Score: the Engagement score for last 12 months from the date the report is submitted
Monthly Average Engagement Score: Engagement score for last 1 month from the date the report is submitted
Difference: The engagement score difference between the last month and 12 months.
MonthAverage is the score for the last month, not an average of 12 months.
MonthAverage - YearAverage = Difference
Increased Engagement Domain
Data is ordered by: Difference in ascending order.
Annual Average Engagement Score: the Engagement score for last 12 months from the date the report is submitted
Monthly Average Engagement Score: Engagement score for last 1 month from the date the report is submitted
Difference: The engagement score difference between the last month and 12 months.
MonthAverage is the score for the last month, not an average of 12 months.
MonthAverage - YearAverage = Difference
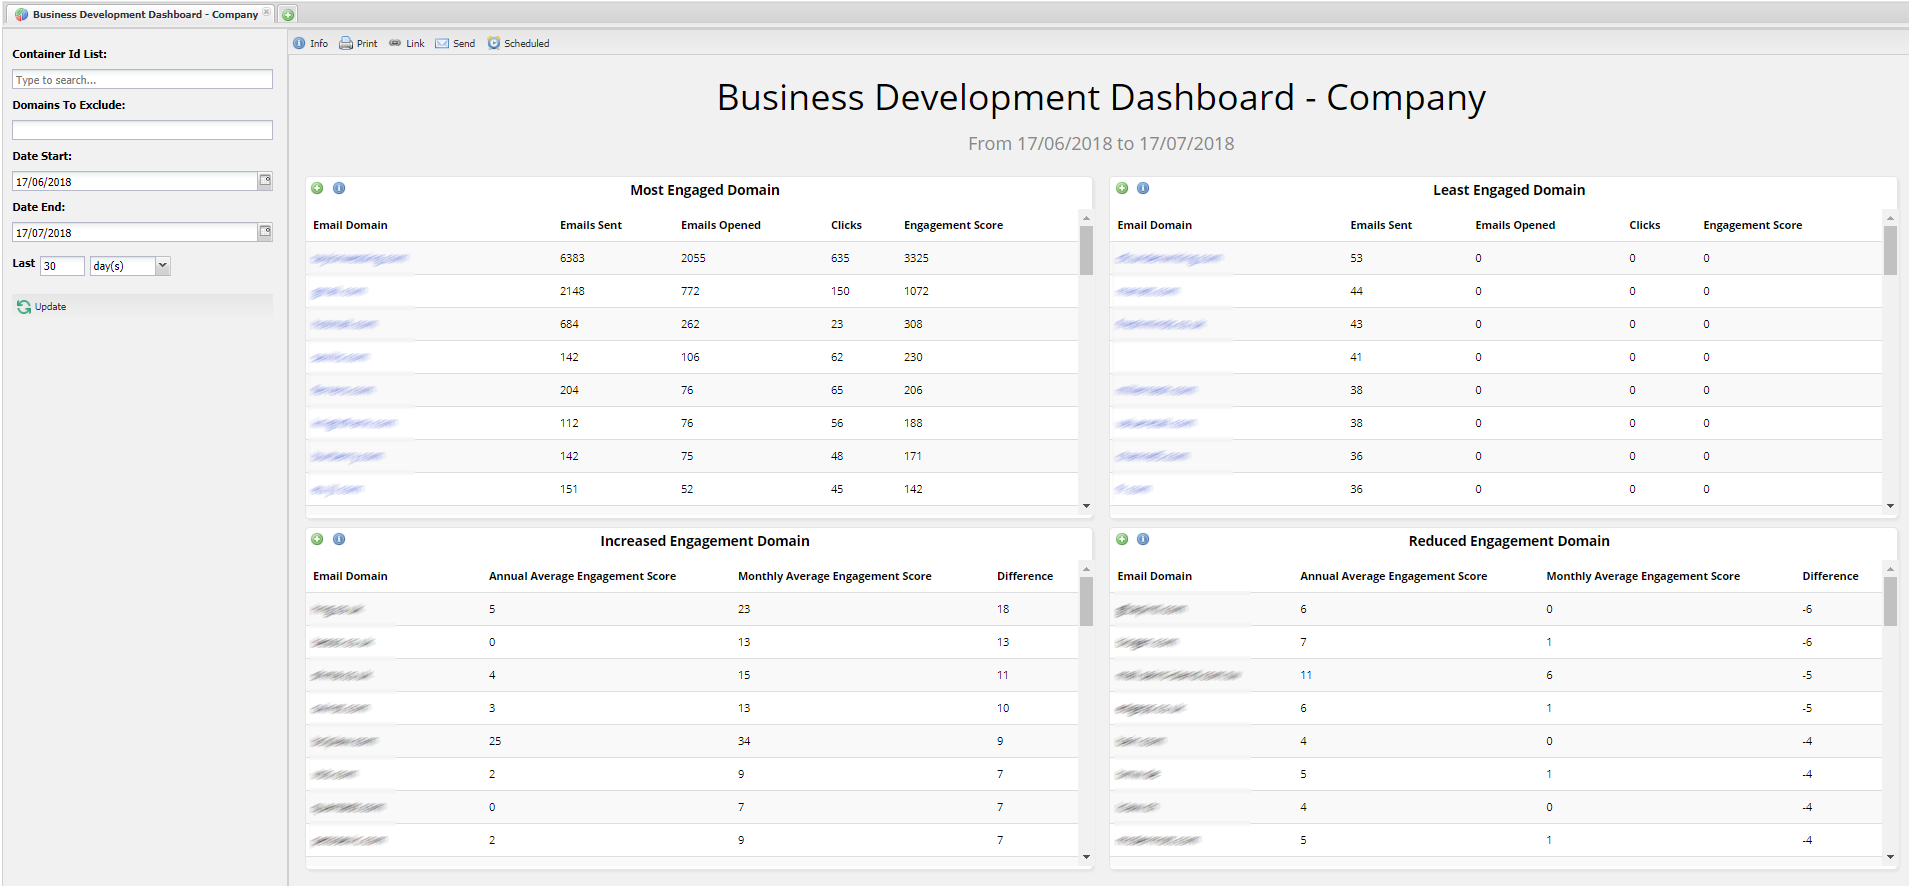
You can send this dashboard to yourself or your colleagues either once or on a recurring basis. Find out how to do this here.
Filters
You can filter this report by container and date range.
You can also exclude specific domains.
Reports in this dashboard
Most Engaged Domain
70: Business Development - Most Engaged Domain
This report shows the domains who have engaged the most based on opens and clicks.
When you drill down from this report you go to 88 Business Development - Most Engaged Domain Full Results
Least Engaged Domain
72: Business Development - Least Engaged Domain
This report shows the domain that have engaged the least.
When you drill down from this report you go to 89 Business Development - Least Engaged Domain Full Results
Increased Engagement Domain
193: Business Development - Increased Engagement Domain
This report shows the domains that have had the biggest increase in engagement.
When you drill down from this report you go to 195 Business Development - Increased Engagement Domain Full Results
Reduced Engagement Domain
196 Business Development - Reduced Engagement Domain
This report shows the domains that had the biggest decrease in engagement.
When you drill down from this report you go to 194 Business Development - Reduced Engagement Domain Full Results