Introduction
When faced with an error message on the screen, most users would prefer to see a clear description of the problem and a clue towards who could help. Should the user contact either Vuture's Support team or the CRM Support team at the client offices?
As a part of Vuture’s efforts to make the platform as easy to use as possible, and for InterAction users only, we have developed an Errors Dashboard.
This Dashboard will display the following information:
-
Duration (Period being examined, in an Hours/Weeks or Date Range drop down)
-
Category of Errors. There are currently 41 Error Categories. They are listed at the end of this document
-
Error Name
-
Meaning (in plain English, including a recommendation for next steps)
-
Date & Time the error occurred
-
Count - number of times it occurred in the period
Prerequisites
-
There is no config needed to enable this Dashboard. Once deployed, it will automatically appear for all instances (if the Role is enabled for the user), under the Help menu at Homepage.Help.Errors Dashboard
-
The Role to enable is at: Admin.Roles.Help.Manage Errors Dashboard
-
The errors dashboard is available for InterAction only.
Process
There is no plan to edit, delete or otherwise interact with the errors from this dashboard. The feature is for visibility only and it should be used to help analyse why an instance may be experiencing repeated issues in an area of operation.
It will be helpful, for example, if a client reports difficulties, to see any errors that were being reported at that time.
How to Use the Dashboard
Navigate to Home.Help.Errors Dashboard
Select the Period (last week, month etc) you wish to examine, using the drop down, or enter dates From and To
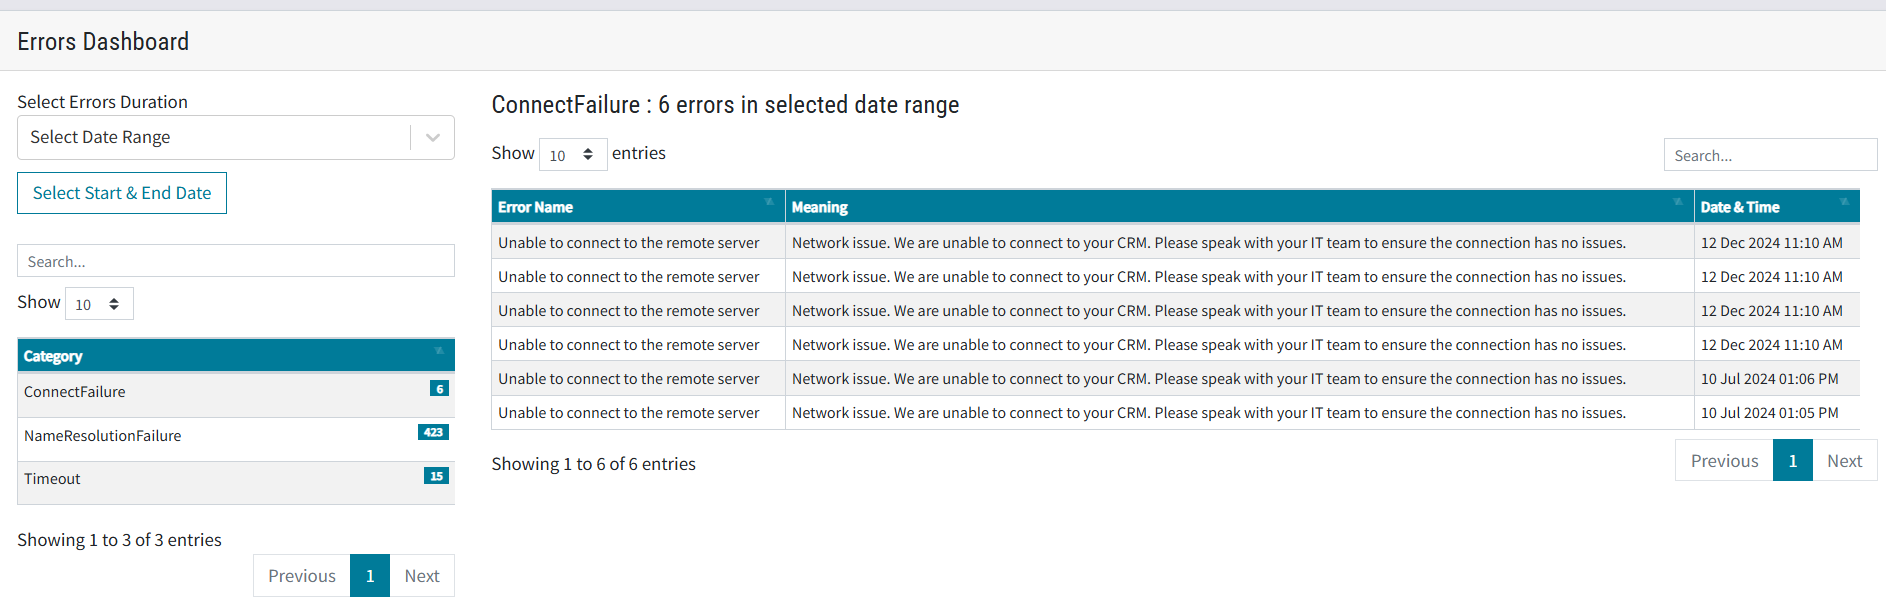
Use the Show dropdown to choose how many errors per page to display
Click on the Category to display
Please note that the “errors” in these images are dummy data, artificially generated for testing purposes. They do not reflect any Vuture instance
What’s New
In the Dashboard users will be able to see, at a glance, the different Categories of error message that have appeared in your platform alongside a plain English interpretation of each technical message and a pointer for next actions.
With the ability to filter by date or by error Category, Admin users or Support will be able to narrow down the date and time of a particular error, or focus on the occasion of each occurrence, if it seems as if the error is appearing with unusual frequency.
Access
The errors dashboard is on a Role which must be enabled at Help.Manage Errors Dashboard.
To access the Errors Dashboard under the Help menu the user should navigate to Admin.Roles.Help.Manage Errors Dashboard.
Error Categories
Currently we have 41 error categories for InterAction. They are:
-
NameResolutionFailure
-
ConnectFailure
-
ReceiveFailure
-
SendFailure
-
PipelineFailure
-
RequestCanceled
-
ProtocolError
-
ConnectionClosed
-
TrustFailure
-
SecureChannelFailure
-
ServerProtocolViolation
-
KeepAliveFailure
-
Pending
-
Timeout
-
ProxyNameResolutionFailure
-
UnknownError
-
MessageLengthLimitExceeded
-
CacheEntryNotFound
-
RequestProhibitedByCachePolicy
-
RequestProhibitedByProxy
-
ContactNotFound
-
InvalidContactId
-
SessionNotAuthenticated
-
InvalidDefinitionid
-
ContactIsNotLinked
-
NotAValidListValueForThisDefinition
-
ThereIsAlreadyAValueDefined
-
YouDoNotHaveSufficientAccessRights
-
RequiredParameterMissing
-
IllegalArgumentException
-
YouDoNotHaveAccessRights
-
NoTypeFound
-
DomainRuleException
-
WriteFailureException
-
UnableToRetrieveInformation
-
SQLException
-
NoActivityFound
-
InsufficientAccess
-
EntityIsDeleted
-
ObjectHasBeenDeleted
-
BatchUpdateException
If any one of the above errors is displayed in the dashboard there will also either be an explanation in plain English and/or a suggestion for the user’s next steps.