Overview
When you send an email through Vuture, you can view the data for that specific campaign from the sent Email Report screen.
Contents
Accessing email reports
- Access this report by clicking on a campaign within a container.
- On the menu on the left hand side click on any previously sent email in the sent folder (e.g. November 2019).
- Then click on the "Email Reports" link in the top right of your screen (see screenshot).

- You should then see the Email Reports screen (example below).
Summary Tab
Snapshot
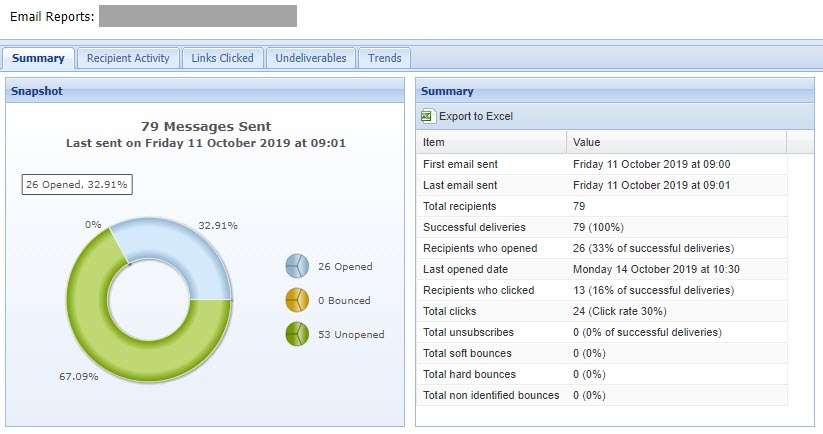
In the graph on left this shows you an overview of the total number of individuals who were sent that campaign along with the last time that campaign was sent out.
Underneath is a donut chart showing a breakdown of the recipients by those who bounced, opened and didn't open that email.
Summary
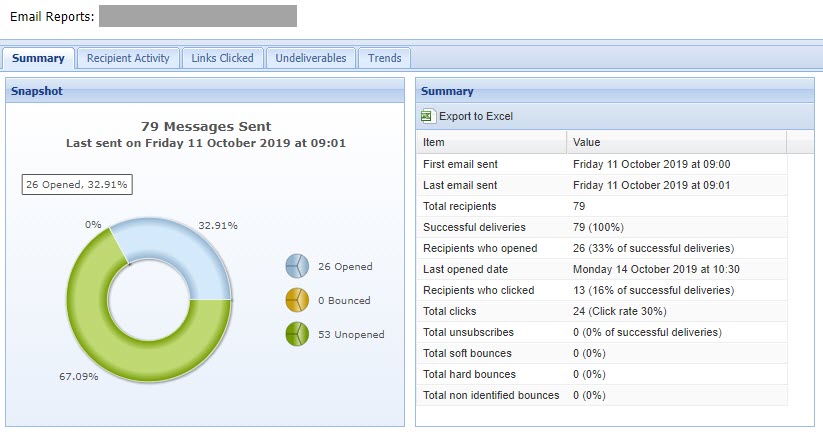
First email sent - shows you the date of the very first time the email was sent
Last email sent - shows you the date of the last time the email sent
Total recipients - shows you the total number of individual recipients who were sent the campaign
Successful deliveries - shows you the total number of individuals who did not bounce. The percentage shows the delivery rate and is is calculated by Total Recipients divided by (Total soft bounces + Total hard bounce + Total non identified bounces)
Recipients who opened - shows you number of recipients who opened your email. The percentage shows the open rate which is calculated by recipients who opened divided by successful deliveries.
Last opened date - shows you the date of the last time the email was opened
Recipients who clicked - shows you the number of individual and unique recipients who click on your email. The percentage shows you the click through rate. It is calculated by recipients who clicked divided by successful deliveries
Total clicks - shows you the total number of clicks your email received. This includes one recipient clicking on multiple links in the email.
Total unsubscribes - shows you the number of individuals who unsubscribed. The percentage shows you the unsubscribe rate which is calculated by dividing unsubscribes by successful deliveries
Total soft bounces - shows you the number of soft bounces.
Total hard bounces - shows you the number of hard bounces.
Total non identified bounces - shows you the number bounces we are not able to identify.
Recipient Activity tab
If you click on the recipient activity tab next to summary you'll be able to see a breakdown of the activity for each recipient.
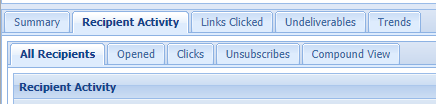
All Recipients - shows you a table that lists every recipient of that email, when they last opened the email and the total number of times they opened and clicked. If a contact did not open or click their data will show zero.
Opened - shows a list of only those contacts that opened the email including the date they opened and the number of unique links they clicked and the total number of times they clicked on any link.
Clicks - show a list of only those contacts that clicked on the email including the date they opened and the number of unique links they clicked and the total number of times they clicked on any link.
Unsubscribes - shows a breakdown of the recipients who unsubscribed
Compound View - shows a table with all the recipients, the date they first opened, last opened, the total number of times they opened along with the number of links they clicked.
Links Clicked
If you click on the Links Clicked tab, you'll see a breakdown of all links clicked, as well as, the most popular links clicked.

All Links - Shows a list of all the times any link in your email was clicked in your email and the email address of the person who clicked and the time stamp
Most popular links - shows you an ordered list of the most popular to the least popular links that were clicked in your email. It also shows the total number of times the links were clicked.
If you click on detail you can then see a list of all the contacts who click on that specific link in your email.
Undeliverables

The undeliverables tab shows you a list of all the contacts who have bounced. It lists the email address, the timestamp of when it bounced along with the Undeliverable type or the reason why it bounced. It also contains detail of the email list in which that contact is found.
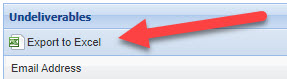
Clicking on 'Export to Excel' will download an Excel file and allow you to see the full Bounceback Message for why a particular email address bounced. You may also decode the Bounceback Text using this Help Desk article.
Trends

The trends tab shows a graph of which hour was the opened most in. This can help give you an idea of when is a good time to send your campaign.