Reports present a specific set of data on a single area of the system. Each report displays data in a table with default data fields. Each report uses a default set of filters. You can further filter the report with specific time frames, containers, or campaigns, depending on the type of report.
You can access all reports by clicking on Reports in the menu on the top right of the home screen.

These reports can be viewed in isolation or combined as part of dashboards. You can find out more about the different dashboards we have here.
From the report view click on the Report Category drop-down. When you select the category you will see a further drop down where you can select the report you wish to view.
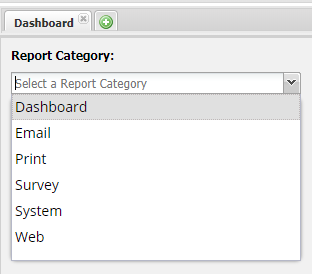
Dashboard: Brings up a list of all the dashboards you have available. Click here for more information on dashboards.
Email: Shows all of the reports that relate to email stats and email behaviour.
Print: If you use the print module this option will show all of the report that relate to print.
Survey: If you use the survey module this option will show all of the report that relate to survey.
System: These reports give you general information about the system.
Web: If you use the web module this option will show all of the report that relate to web.